The Summary for Policy Makers (SPM) of the IPCC Working Group on Mitigation to the 5th Assessment Report ( see http://report.mitigation2014.org/spm/ipcc_wg3_ar5_summary-for-policymakers_approved.pdf ) was approved and the full report was accepted by the IPCC Plenary on April 12 (see http://mitigation2014.org/report/final-draft/ ). What are its main messages? Are these the messages that policy makers need to know? And what is not being said?
What are current trends?
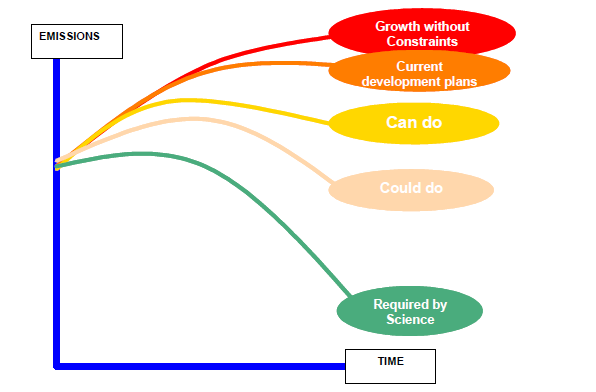
Current trends in emissions, the underlying energy system and efforts to reduce emissions go in the wrong direction:
- Greenhouse gases emissions are rising faster than ever before. Between 2000 and 2010 global GHG emissions rose with 2.2% on average, despite an increasing number of countries implementing emissions reduction policies. Between 1970 and 2000 the increase was 1.3% per year. Total GHG emissions are now 49 Gigaton CO2 equivalent.
- The carbon content of energy has increased over the last decade, reversing a declining trend since 1970. This is caused by a sharp increase in the use of coal. It dwarfed the emission reductions from the significant increase in the use of renewable low-carbon energy sources that in 2012 represented more than 50% of the new power capacity added to the global grid.
- Current trends are expected to lead to a 4-5°C increase of global temperatures by 2100, compared to pre-industrial levels, with further increases thereafter. Without further mitigation action beyond what is in place today atmospheric greenhouse concentrations are expected to rise till 750-1300 parts per million of CO2 equivalent by the end of the century, corresponding to 4-5°C higher temperatures than pre-industrial ones. Concentrations and temperatures will further increase after 2100.
- Current emission reduction efforts fall short of a cost-effective path to keep temperature increase below 2°C, the limit unanimously agreed by countries in 2010 in order to avoid unmanageable risks of climate change.
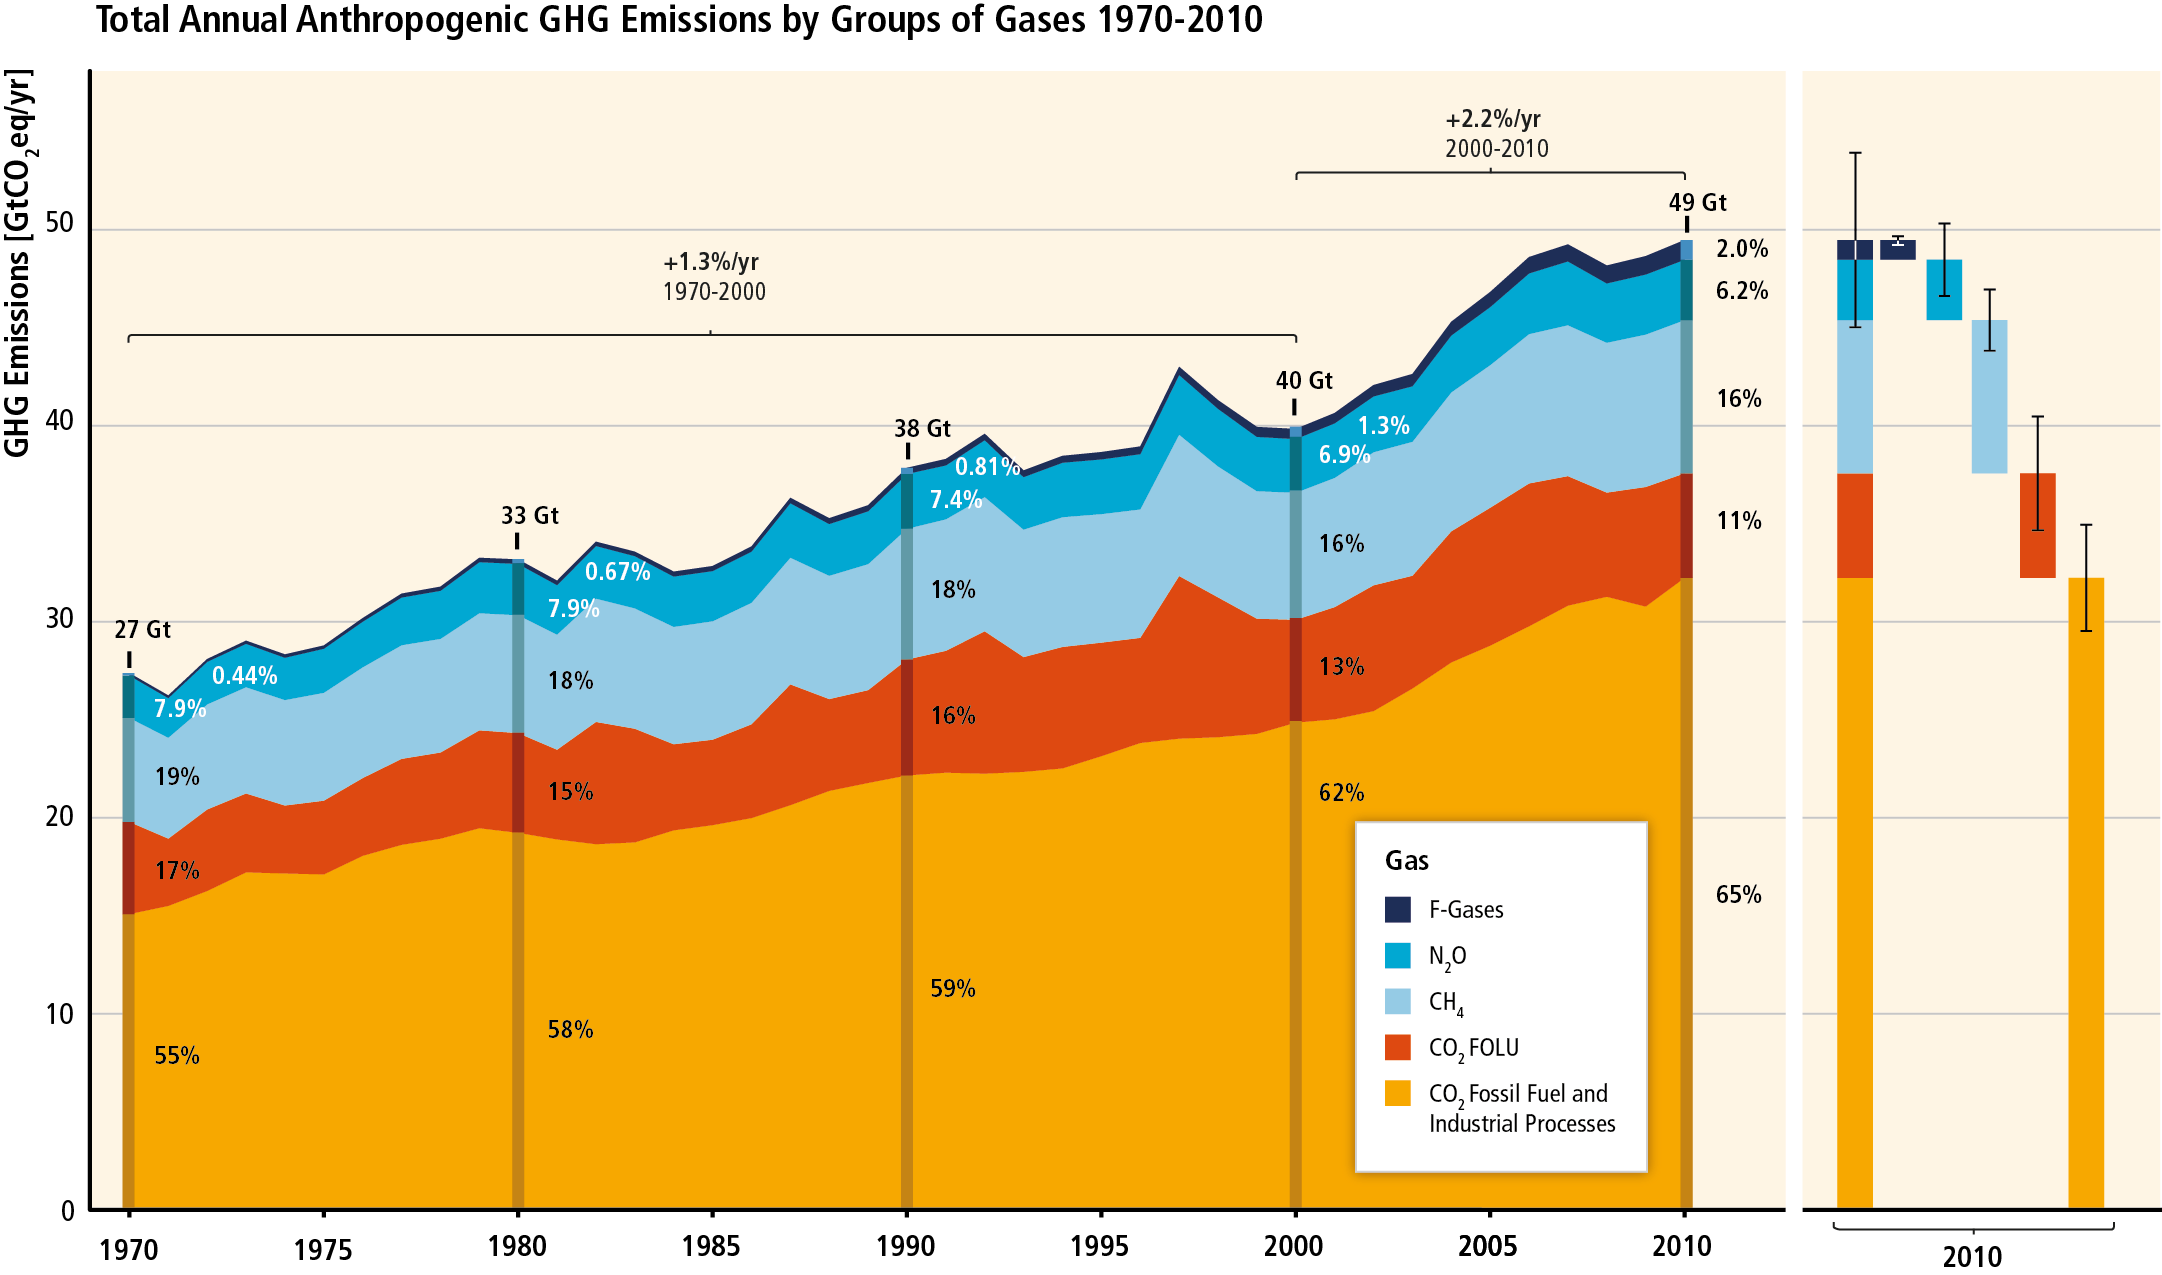
Figure SPM.1. Total annual anthropogenic GHG emissions (GtCO2eq/yr) by groups of gases 1970-2010: CO2 from fossil fuel combustion and industrial processes; CO2 from Forestry and Other Land Use (FOLU); methane (CH4); nitrous oxide (N2O); fluorinated gases8 covered under the Kyoto Protocol (F-gases). At the right side of the figure GHG emissions in 2010 are shown again broken down into these components with the associated uncertainties (90% confidence interval) indicated by the error bars. Total anthropogenic GHG emissions uncertainties are derived from the individual gas estimates as described in Chapter 5 [5.2.3.6]. Global CO2 emissions from fossil fuel combustion are known within 8% uncertainty (90% confidence interval). CO2 emissions from FOLU have very large uncertainties attached in the order of ±50%. Uncertainty for global emissions of CH4, N2O and the Fgases has been estimated as 20%, 60% and 20%, respectively. 2010 was the most recent year for which emission statistics on all gases as well as assessment of uncertainties were essentially complete at the time of data cut off for this report. Emissions are converted into CO2-equivalents based on GWP100 from the IPCC Second Assessment Report. The emission data from FOLU represents land-based CO2 emissions from forest fires, peat fires and peat decay that approximate to net CO2 flux from the FOLU as described in chapter 11 of this report. Average annual growth rate over different periods is highlighted with the brackets. [Figure 1.3, Figure TS.1] [Subject to final quality check and copy edit.] [source IPCC AR5 WG 3 SPM]
Can temperature rise still be kept below 1.5 or 2°C?
All countries of the world agreed in 2010 that temperatures should not increase more than 2oC above pre-industrial, preferably even 1.5°C. With the current trend pointing to 4-5°C or more, will that still be possible?
- Many scenario studies confirm that it is technically and economically feasible to keep temperature rise below 2°C, with 70% probability (”likely chance”). This would imply limiting atmospheric concentrations to 450 ppm CO2 equivalent by the end of the century. If a 50-50 chance of staying below 2°C would be acceptable, then the concentration limit is 500 ppm (provided the overshoot in the interim is not beyond 530 ppm).
- Such scenarios for a 70% chance imply halving global emissions compared to 2010 by mid-century and zero or negative emissions by 2100. Depending on the degree of delay in reduction efforts the reduction is 40-70% below 2010 by 2050. For a 50-50 chance of staying below 2°C these numbers are going down only a little: 25-55% % emissions reduction. By the end of the century net emissions have to be zero or negative, implying large removals of CO2 from the atmosphere by bioenergy with CCS (BECCS) or afforestation.
- Keeping global temperature increase below 1.5°C would require even lower atmospheric concentrations (<430 ppm) to have a little more than 50% chance. There are not many scenario studies available that can deliver such results, requiring even faster reductions in the medium term, indicating how difficult this is, given where we are now.
- Scenarios that keep temperature increase to less than 2°C with a likely chance, show rapid increases of energy efficiency, a huge increase in low carbon electricity generation (to 60% share by mid-century) and extensive use of CO2 capture and storage – CCS). Large amounts of renewable energy, nuclear power, fossil fuel power plants with CCS and biomass fueled plants with CCS (BECCS), will be needed to realize the massive emission reductions (more than 90% by mid-century) in the energy supply sector, a huge transition operation.
- Average global macro-economic costs of such reduction pathways that minimize costs over the century are modest compared to expected economic growth, and economic co-benefits and avoided climate change impacts more than compensate for these costs in most countries. Under a cost-effective approach, implying mitigation action in all countries starting immediately, a global carbon price and all key technologies applicable so that costs over the century are minimised, macro-economic costs of a 2°C scenario are limited: an average annual reduction of consumption of about 0.04-0.14 percentage points (from a baseline increase of consumption of 1.6-3% per year). Under practical conditions where ideal conditions do not apply, costs will be higher. There are many co-benefits of pursuing a 2°C scenario (in particular reduced health and ecosystem damages due to reduced air pollution and improved energy security, but also for instance biodiversity conservation, food security and employment ) that in many cases provide a net economic benefit, even accounting for potential negative side-effects. The report unfortunately does not quantify them. The economic costs of climate change impacts (not mentioned explicitly) was estimated in the IPCC Working Group II report (see http://ipcc-wg2.gov/AR5/images/uploads/IPCC_WG2AR5_SPM_Approved.pdf ) at least at 0.2-2% annually by mid-century.
- The report underestimates the serious risks of the current lack of action. The report acknowledges that current pledges from countries of intended reductions are not consistent with a cost-effective approach to drastic emission reductions. As the UNEP Emissions Gap Report 2013 showed, global emission levels in 2020 are likely to be way above the levels necessary to do the transition in a cost-effective manner. Many of the models that generate so called delayed action scenarios are able to drive down emissions after 2020 aggressively by applying more stringent efficiency improvement, more rapid introduction of renewables, nuclear power, CCS and particularly CO2 removing technologies like BECCS or large scale afforestation. Given well known problems with expansion of nuclear power, the costs and public concern about CCS and the questions about the sustainability of large-scale biomass production for BECCS, the practical feasibility of such aggressive technological changes is questionable, i.e. this approach may very well fail to keep temperature increase below 2°C. The UNEP report mentioned above says these risks out in detail, but the IPCC report only mentions them in passing. Interestingly the IPCC does say “ Many models could not achieve atmospheric concentration levels of about 450 ppm CO2eq by 2100 if additional mitigation is considerably delayed or under limited availability of key technologies, such as bioenergy, CCS and their combination (BECCS)
- Not only the risks but also the costs of delayed action are high. Delayed action till 2020 or 2030 (more or less what is currently happening) adds 15-80% to the costs in the medium term, because further lock-in into a high-carbon infrastructure will have happened. Such lock-in, says the SPM, “may be difficult or very costly to change, reinforcing the importance of early action for ambitious mitigation.” Chapter 6 adds an important point: “Studies suggest that important transitional economic metrics other than aggregate costs — for example, reduced growth rates in economic output and consumption, escalating energy prices, and increasing carbon rents — may be more affected by delayed mitigation than aggregate costs” (Chapter 6, section 6.3.6.4)
The report confirms that technologies and practices for all economic sectors are available to bring emissions down in line with cost-effective 2°C scenarios.
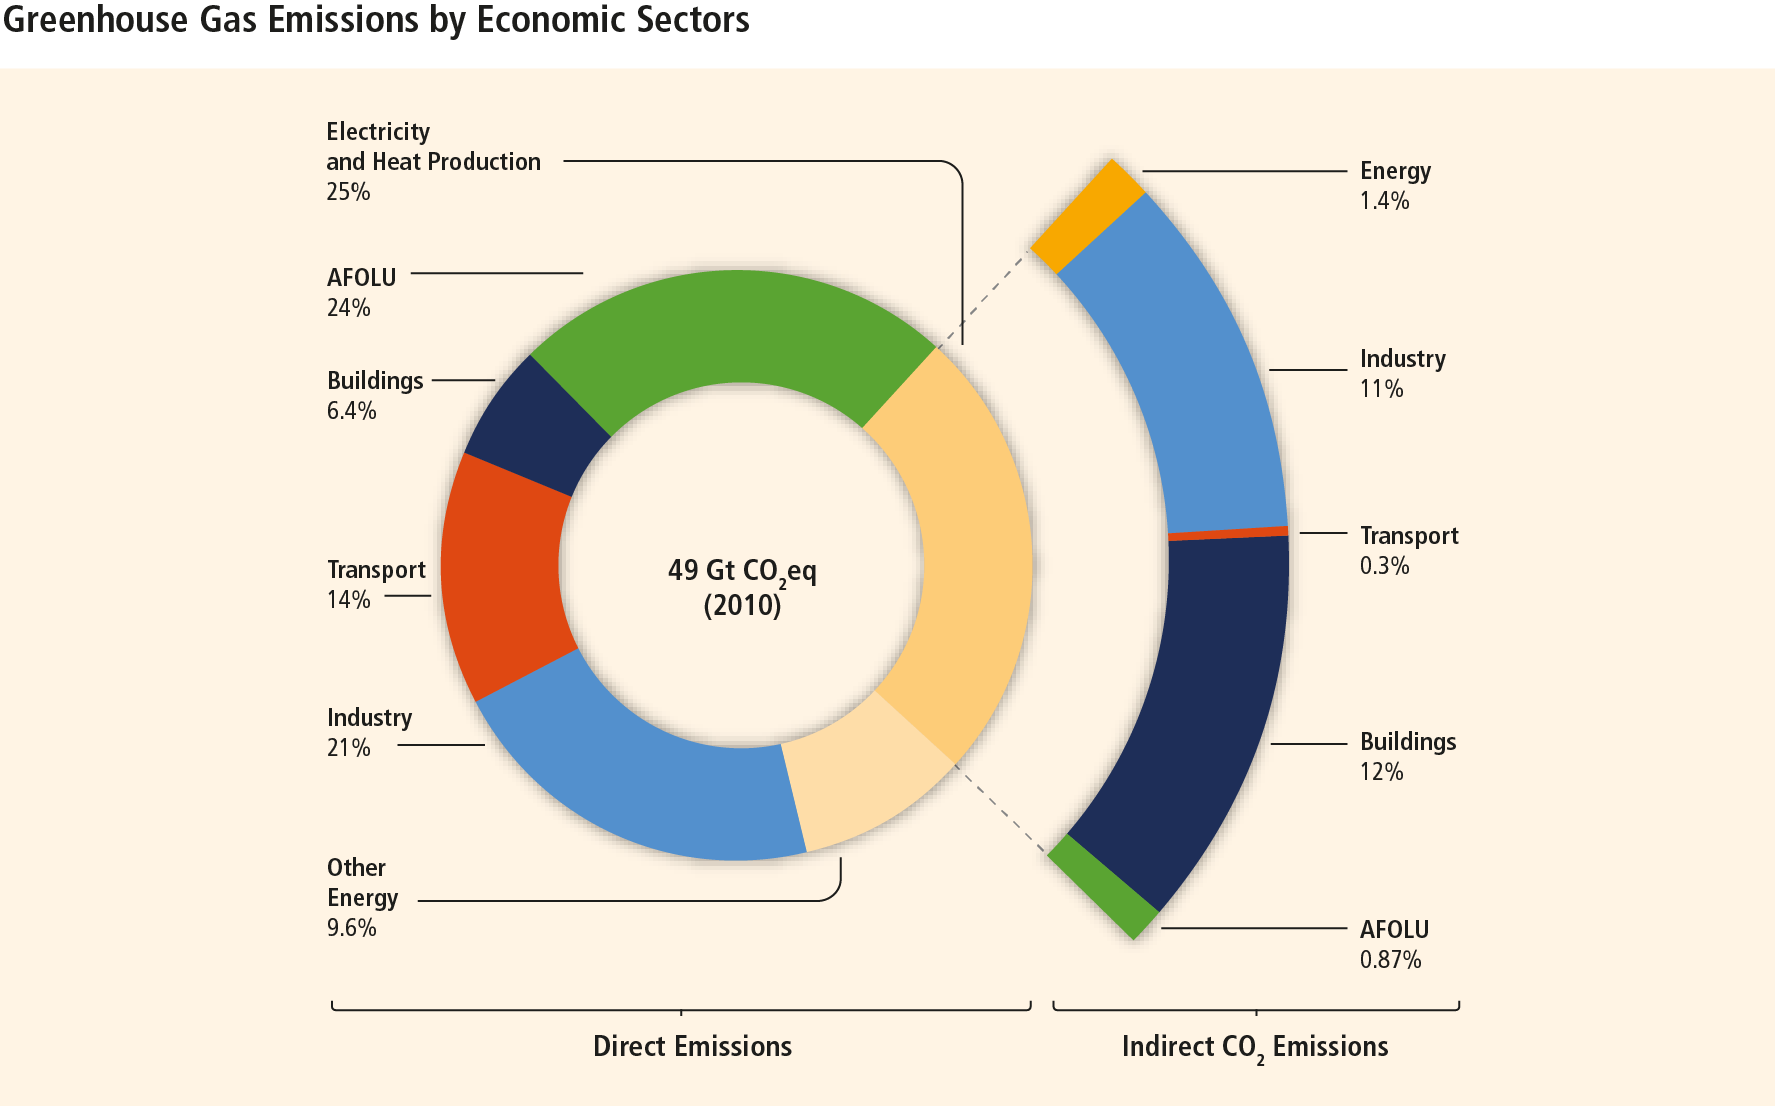
Figure SPM.2. Total anthropogenic GHG emissions (GtCO2eq/yr) by economic sectors. Inner circle shows direct GHG emission shares (in % of total anthropogenic GHG emissions) of five economic sectors in 2010. Pull-out shows how indirect CO2 emission shares (in % of total anthropogenic GHG emissions) from electricity and heat production are attributed to sectors of final energy use. “Other Energy” refers to all GHG emission sources in the energy sector as defined in Annex II other than electricity and heat production [A.II.9.1]. The emissions data from Agriculture, Forestry and Other Land Use (AFOLU) includes land-based CO2 emissions from forest fires, peat fires and peat decay that approximate to net CO2 flux from the Forestry and Other Land Use (FOLU) sub-sector as described in Chapter 11 of this report. Emissions are converted into CO2-equivalents based on GWP100 from the IPCC Second Assessment Report. Sector definitions are provided in Annex II.9.[Figure 1.3a, Figure TS.3 a/b] [Subject to final quality check and copy edit.] [Source IPCC AR5 WG3]
- Energy efficiency improvements that lower energy demand are an essential element of mitigation strategies for keeping temperature increase below 2°C. The potential of end-use energy efficiency improvement in transport, buildings and industry is large: at least about 40-60, 30-60 and 30-50% respectively by 2050, compared to the baseline (see figure 6.37). Clear cost numbers are not available. The carbon intensity of energy carriers will of course determine the overall emission reduction.
- Changes of human choices in transport modes, diet, energy use in households, and purchasing long-lasting products can also have a large contribution to emission reduction. The potential is very hard to quantify.
- In the energy supply sector the significant cost reduction of renewables and the sharp increase in volume are a positive development, but increased coal use, a declining share of nuclear power and lack of progress with application of CCS is limiting progress towards decarbonisation of electricity supply. The potential for a 90%+ reduction of emissions by mid-century is there, with fossil fuel with CCS and bioenergy with CCS (BECCS) being critical technologies to keep costs down. Leaving nuclear power from the technology mix has a much smaller impact on cost increase.
- What the report– unfortunately- does not say is that new coal fired power plants without CCS are incompatible with 2°C scenarios. It is a direct consequence of the fact that the cumulative CO2 emissions budget consistent with 2°C has been used up already too much to allow for new long living coal fired power plants. See http://www.europeanclimate.org/documents/nocoal2c.pdf. This is a very relevant point for policy makers dealing with energy supply, since new coal fired power plants are still being planned in large numbers. What the report does say is that natural gas without CCS can have role as a transition fuel in the medium term. It means in the longer term CCS will also be essential for natural gas fired power plants.
- Available technologies and practices in the transport sector will allow an emission reduction of 15-40% below baseline by 2050, while transport demand growth would otherwise lead to doubling of emissions. Cost numbers are not available. Measures will be combination of technical improvements in vehicle design, low-carbon fuels, mode shifts for passenger and freight transport, as well as urban planning to reduce the need for transport and make it easy for people to walk or cycle.
- In buildings there are big opportunities for emission reduction in new and renovated building at low or sometimes at negative costs, but they have not been quantified. Given the long life of buildings, delaying action will lead to lock-in of inefficient new buildings that will be very costly to renovate later. In developed countries changes in lifestyle and behavior could halve energy demand by mid-century compared to today.
- Industry, the biggest emitting sector, has significant opportunities to improve energy efficiency, efficiency of material use, recycling and reuse in the short term, allowing emissions to get below a fast growing baseline. Many of these opportunities will be made attractive by regional collaboration between industries. For more significant reductions in the longer-term radical process and product innovations, low carbon electricity and application of CCS in cement and steel production will be needed.
- Emissions from agriculture and forestry have stabilized and are now declining, mainly due to a reduction in deforestation rates and increased forest planting. Further reductions are possible. Reductions of about 75% of current emissions can be achieved by afforestation, sustainable forest management, reducing deforestation, cropland and grassland management and restoration of degraded soils.
- Urban areas provide unique opportunities to deliver reductions from integrated transport, building and infrastructure measures and reap many other social and economic benefits. Urban areas cover 52% of global population now, increasing to about 65% by 2050. They are responsible for 70% of energy use and 75% of CO2 emissions, with a strong increase expected. As this requires a lot of new urban development, a low carbon infrastructure can be built.
What are effective policy instruments to realize the large reduction potential?
- Different policy instruments are discussed in the report, but no attempt was made to show best practice approaches that have proven effectiveness. Policy makers would have benefitted from such best practice information, as there is always resistance from vested interests and questions about effectiveness of policy design.
- Phasing out fossil fuel subsidies (estimated at about $ 470 bn/yr direct subsidies or $ 1850 bn/yr including indirect subsidies) will lead to global emission reduction and economic growth, but is politically difficult to implement in most countries. The use of lump-sum cash transfers to low income groups has proven to be a good way to avoid negative impacts on these low-income groups.
- The report points –rather modestly- to multiple objective policy packages to provide proper incentives for action. Co-benefits are mentioned prominently in the report, reflecting a very climate centric perspective. Taking a broader perspective where policies aim at multiple benefits and may be driven even more by other non-climate concerns such as congestion, air quality or energy import dependence would be more realistic and more relevant for policy making. The multiple objectives approach may in fact be one of the most promising ways to overcome the barriers to introducing ambitious policies. They would exploit the important co-benefits (or better: other benefits) of policy instruments, thereby broadening the constituencies that would benefit and mobilizing forces for more ambitious action. Things that are not clearly conveyed by the report. In a blog Rachel Kyte, vice president for sustainable development of the Worldbank, refers to her recent discussions with a group of finance ministers: “Often, policies that bring emissions reduction benefits also bring other more tangible benefits. Framing policies their way may expand support. Take transportation: Improving vehicle standards and investing in and increasing the use of public transportation reduces outdoor air pollution that contributes to asthma, heart disease, lung cancer, and 3.7 million deaths a year – and it reduces greenhouse gas emissions.” (see http://blogs.worldbank.org/voices/ipcc-longer-world-waits-address-climate-change-higher-cost )
- The report does not provide much help in figuring out how to make ambitious climate action happen in practice. The messages from the 5th assessment report are not very different from those coming out of the 4th report 7 years ago. So why has climate action been insufficient when all the possibilities were there and costs were low? Without better clues on how to make ambitious mitigation action happen in light of all the barriers in place, the risk is that the IPCC messages will again fall at deaf ears. The report does not provide the necessary insights on how to make it happen. The previous point about a multiple benefit approach goes in the right direction, but was not emphasized much in the SPM.
Investment
- Current investments in climate change mitigation and adaptation are about $ 360 billion per year, most of which goes to mitigation. For comparison: the total annual investment in the energy sector is about $ 1200 billion. Private investment form 70-75% of it. Public funds flowing to developing countries are about $40 billion/yr and private inflow in developing countries also about $40 billion/yr.
- For a 2°C scenario large shifts in investment will be needed between now and 2030: low carbon electricity generation +$ 150 bn/yr, end-use energy efficiency +$ 340 bn/yr, fossil fuel extraction and fossil fired power plants -$ 80 bn/yr.
- As investments are mostly private, public policies and incentives should trigger this shift in investment. The report pus emphasis on credit insurance, concessional finance, power purchasing agreements and feed-in tariffs as prime examples of such policies and incentives and also points to the need for an appropriate investment climate.
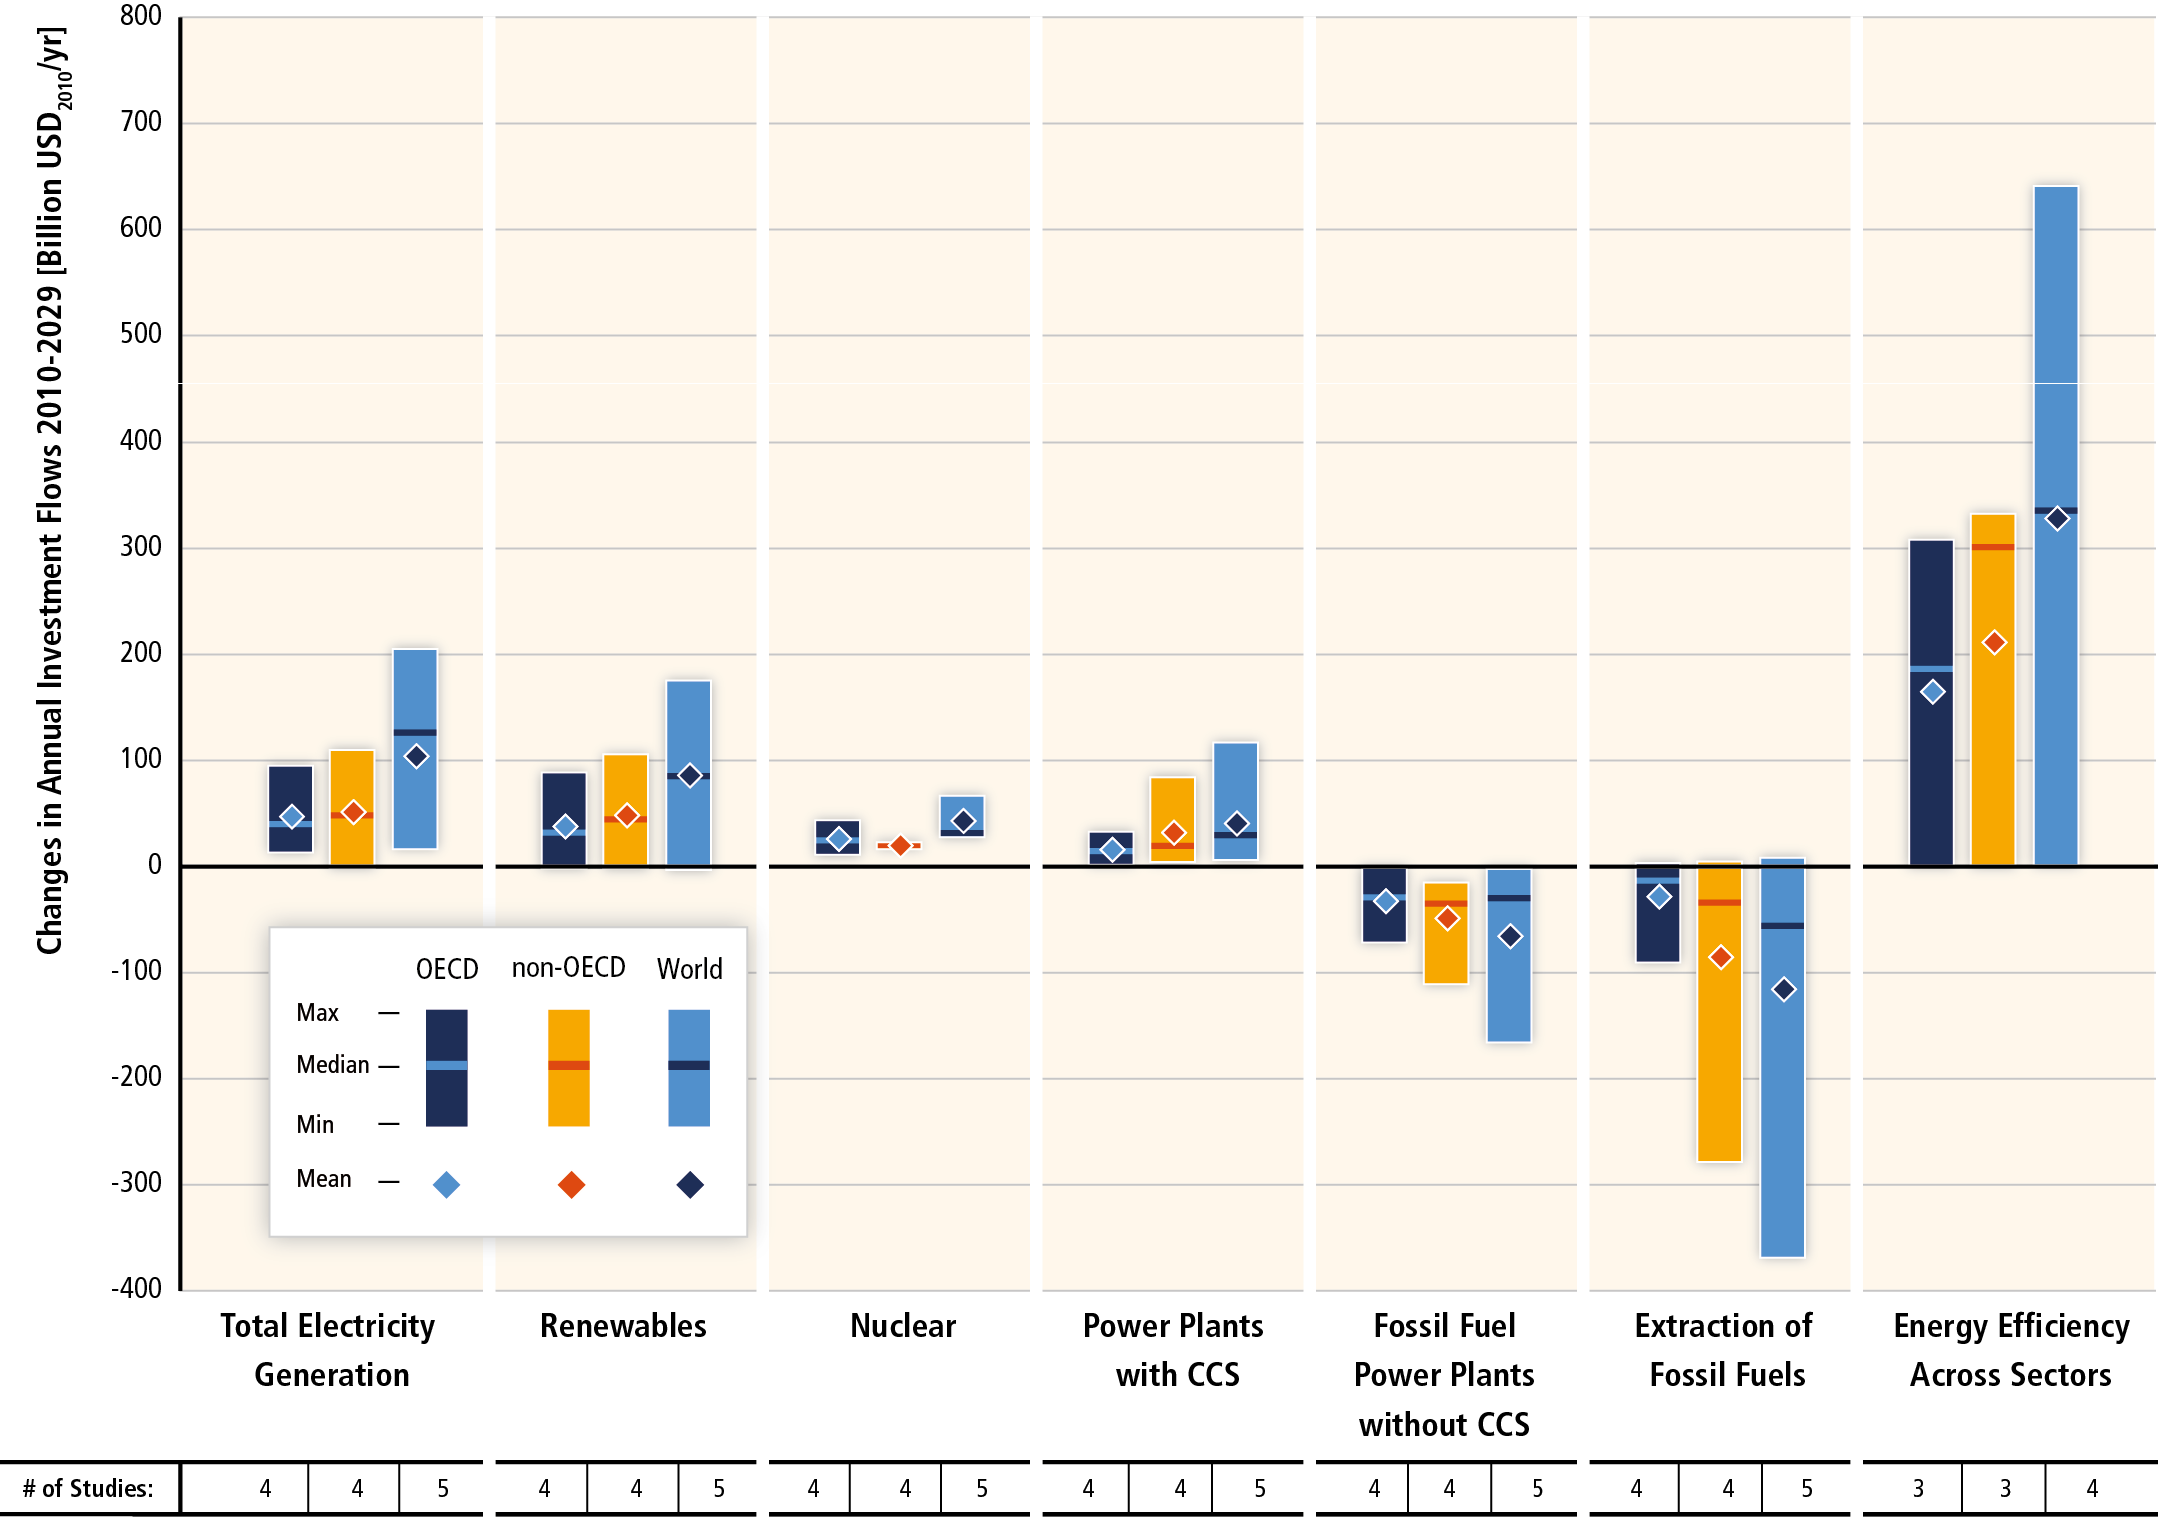
Figure SPM.9. Change in annual investment flows from the average baseline level over the next two decades (2010 to 2029) for mitigation scenarios that stabilize concentrations within the range of approximately 430–530 ppm CO2eq by 2100. Investment changes are based on a limited number of model studies and model comparisons. Total electricity generation (leftmost column) is the sum of renewables, nuclear, power plants with CCS and fossil power plants without CCS. The vertical bars indicate the range between minimum and maximum estimate; the horizontal bar indicates the median.
Proximity to this median value does not imply higher likelihood because of the different degree of aggregation of model results, the low number of studies available and different assumptions in the different studies considered. The numbers in the bottom row show the total number of studies in the literature used for the assessment. This underscores that investment needs are still an evolving area of research that relatively few studies have examined. [Figure 16.3] [Subject to final quality check and copy edit] [source IPCC AR5 WG3 SPM]
International cooperation
The summary for policy makers of the report is extremely vague on the role and instruments of international cooperation. The full chapter on international cooperation does not provide a thorough analysis of how to make international agreements more effective, which would have been a much-needed contribution to more ambitious climate action.